
OVERVIEW
How does one learn about one of the most important issues of our time? And how can we ensure that information is reliable? I was part of an ambitious project to create a product that informs users on the climate change issues that they are interested in by sources that they trust.
TEAM
Carly Addison
Amani Sheikh
Erica Krivda
Annie Foxen
MY ROLE
Assisted in research, synthesis and problem definition processes and led the mobile wireframes, high-fidelity mockups and prototype.
METHODS USED
User Interviews
Journey Map
User Flows
User Personas
Design Studios
Wireframes
Prototypes
Usability Testing
High Fidelity Mock Ups
Research Phase
Screener Survey
For this project, choosing our topic was completely up to us. We created a topic map to help us hone in on climate change, something we all feel passionate about and were excited to learn more about. Our goal was to understand how users currently learn about climate change and whether or not users take measures to combat it in their daily lives. We sent out a screener survey to target the right audience across a balance of appropriate demographics. What criteria did we look for?
Believe that climate change is an issue
Regularly seek out information on climate change (whether from social media, news sources or other)
User Interviews
Of the 31 respondents, we interviewed 7 people that met our screener criteria. To uncover how users learn about the issue and whether or not they take measures to combat climate change, we asked the following questions.
What comes to mind when you think of climate change?
What pain points do you have when seeking out information?
When was the last time climate change influenced a decision that you made?
Synthesizing Our Research
Affinity Mapping
After our interviews, we synthesized the data collected through the creation of an affinity map. This process helped us identify trends when we had a lot of mixed data.

Affinity Map
Key Insights through Affinity Map

Persona

Journey Map
Next we created a journey map to help us visualize the process that our persona goes through to currently complete her goal. We did this to pinpoint a specific problem in the climate change information-seeking journey that our app would be able to deliver a solution for. To make sure we didn’t miss out on any potential opportunities, we mapped an entire day in the life of our target user, from small steps she takes to already reduce her carbon footprint to getting frustrated by the vast amount of information thrown at her.

Since we were able to uncover and visualize her main frustrations, we were able to agree on the main area of opportunity to focus on: finding a way to narrow down the amount of sources that the user receives on climate change. The user journey also helped us form our problem statement below.
Problem Statement
Insight: People don’t know how to make an impact on climate change
and get frustrated when looking for information.
Shay is overwhelmed by the amount and diversity of information regarding climate change. How might we organize the information for Shay to make it more digestible?
Ideation and Design Phase
Proposed Solution and Platform Choice
greenfeed, an iOS application that curates credible & comprehensible information surrounding climate change. The account creation feature resulted in an iOS application design versus a website. An additional feature within the app integrates actionable items for our users that can be completed daily or whenever they choose. An application will better serve this functionality due to its accessibility and mobility. Our research also showed that our users are currently reading news on their mobile devices.
MoSCoW Mapping to Prioritize Features
We could dream up a million features to include in our website that would help our users accomplish their goal of coordinating plans; however, this being a new product, we really wanted to avoid featuritis and focus on just a few key features to achieve our MVP. We determined these features through MoSCoW mapping.

Key Insights to Inform Design Decisions

Design Studio & Low-Fidelity Wireframes
Our team performed two rounds of design studio to start brainstorming what our product might look like. The sketch below shows the initial on-boarding process the user would go through when setting up their account.

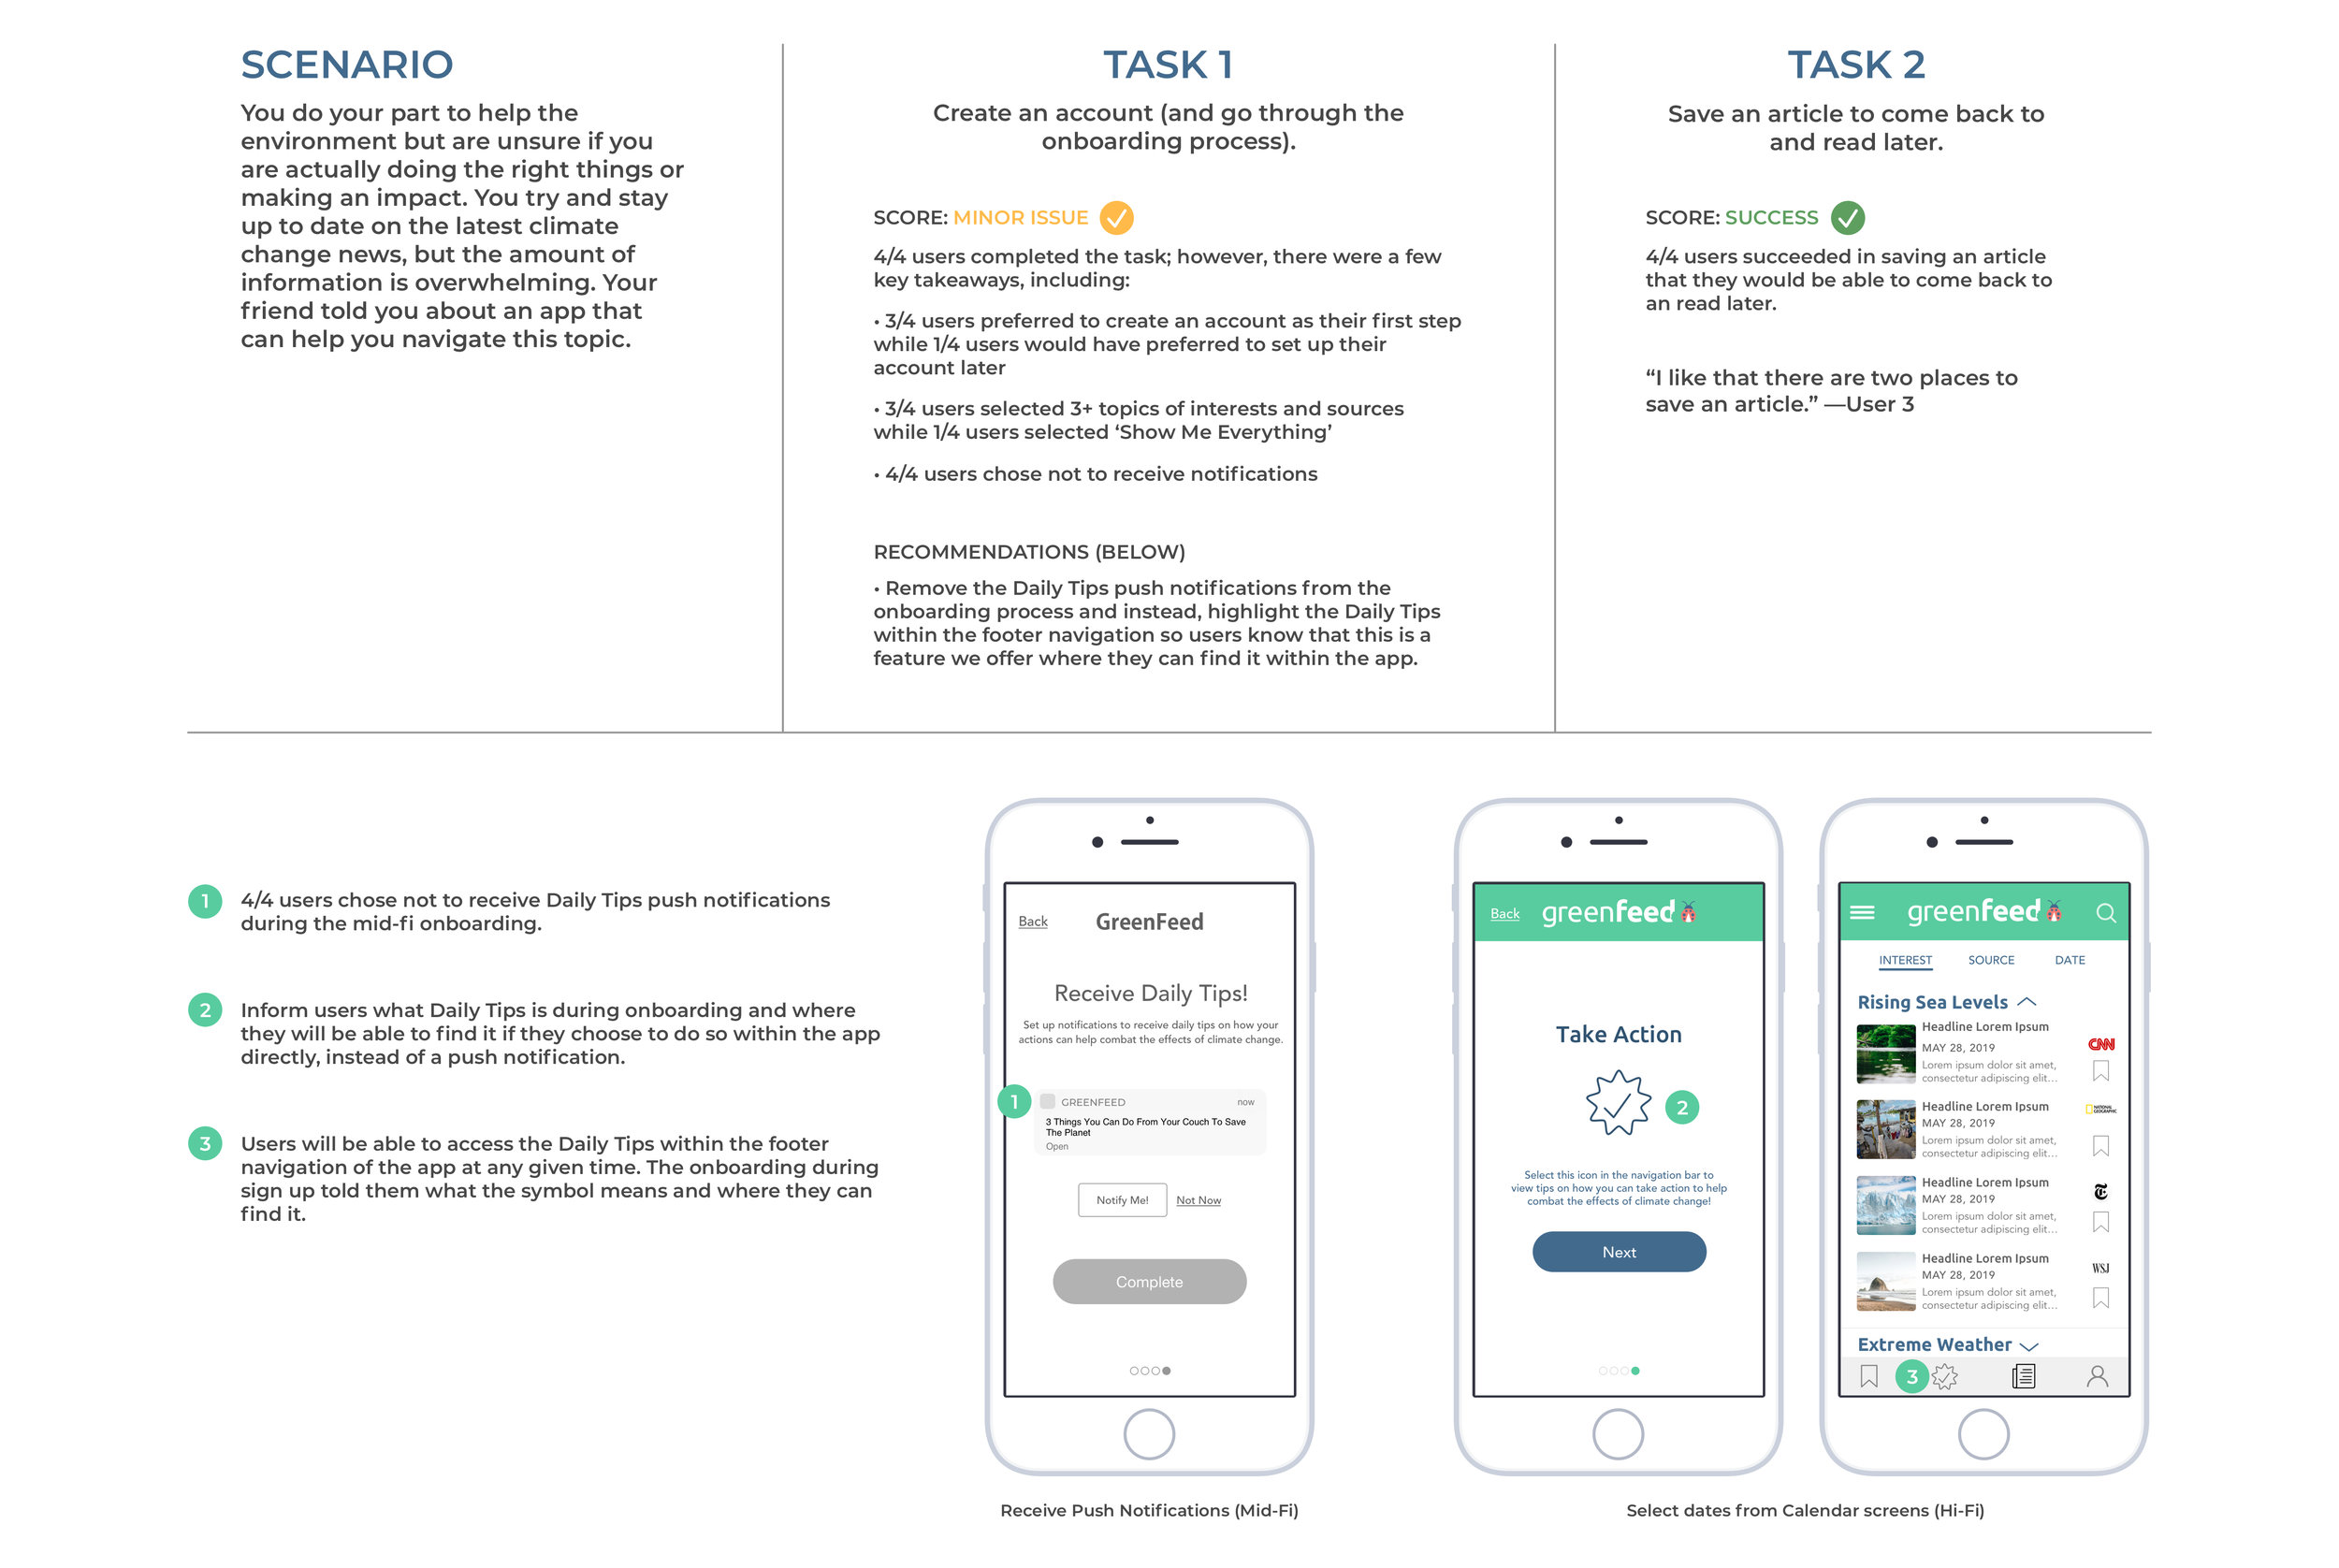
Usability Testing using Mid-Fidelity Wireframes
Once we felt our design decisions addressed our main needs of our users, we tested our mid-fidelity prototype. We tested four participants and gave them one scenario and two different tasks (below).
Additional Hi-Fidelity Wireframes

UI Elements and Style Guide
During our initial user interviews, we learned that users were turned off by the alarmist images and headlines that often go hand-in-hand with climate change-related articles. With that in mind, we chose a primarily cool color palette to evoke a calm and positive feel, while still being authoritative.

Next Steps
Iterate for Usability
Address issues that arose during our final round of usability testing, i.e add labels below the icons in the footer navigation so that our users can understand their meaning.
Update the “Take Action” screen during onboarding so that all of our users understand this feature.
Implement New Features
A share feature so that users can share articles with friends on social media, text or email.
A feature for users to search for engagement opportunities within their local communities. This feature would help to build out the ‘action’ component of our product, speaking to the user’s needs of acting on climate change.
We would need to undergo further rounds of usability testing to test these updates.
Learnings
The biggest takeaway for me during this project was that if you don’t immediately see a trend in your research, you either need to go back to your research and keep digging and write down more insights OR perhaps the trend is that there is no trend. In this case, there was no one way that users sought out information on climate change, so that’s what we aimed to provide to them. That was our solution.